All information in one place
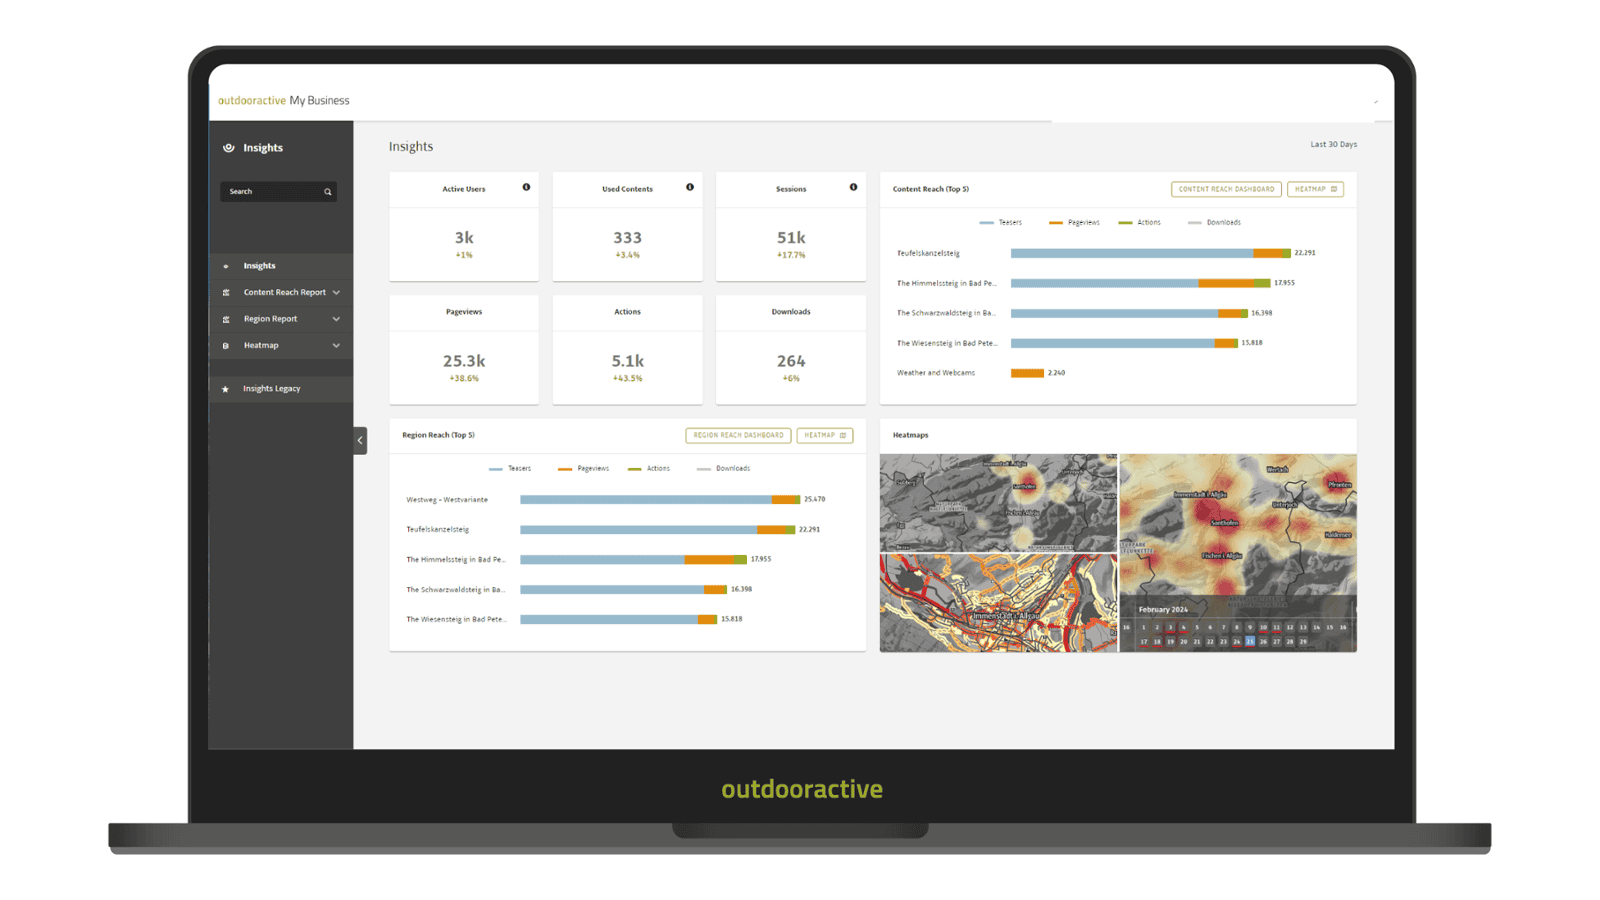
Insights at a glance
The Overview Dashboards for each report give you instant, helpful feedback on user engagement with your content—how it's being used and what is most popular.
Easy-to-read graphs and a simplified interface, let you easily take a deep dive into content and region reports as well as user heatmaps.
Pro feature.
Fully understand your content's performance
With the Content Reach Report you can easily identify your most successful content types, in what format, on which channels it is viewed, and track its seasonal popularity. Plus, view a heatmap of your content's location.
Pro feature.


Fully understand your content's performance
With the Content Reach Report you can easily identify your most successful content types, in what format, on which channels it is viewed, and track its seasonal popularity. Plus, view a heatmap of your content's location.
Pro feature.

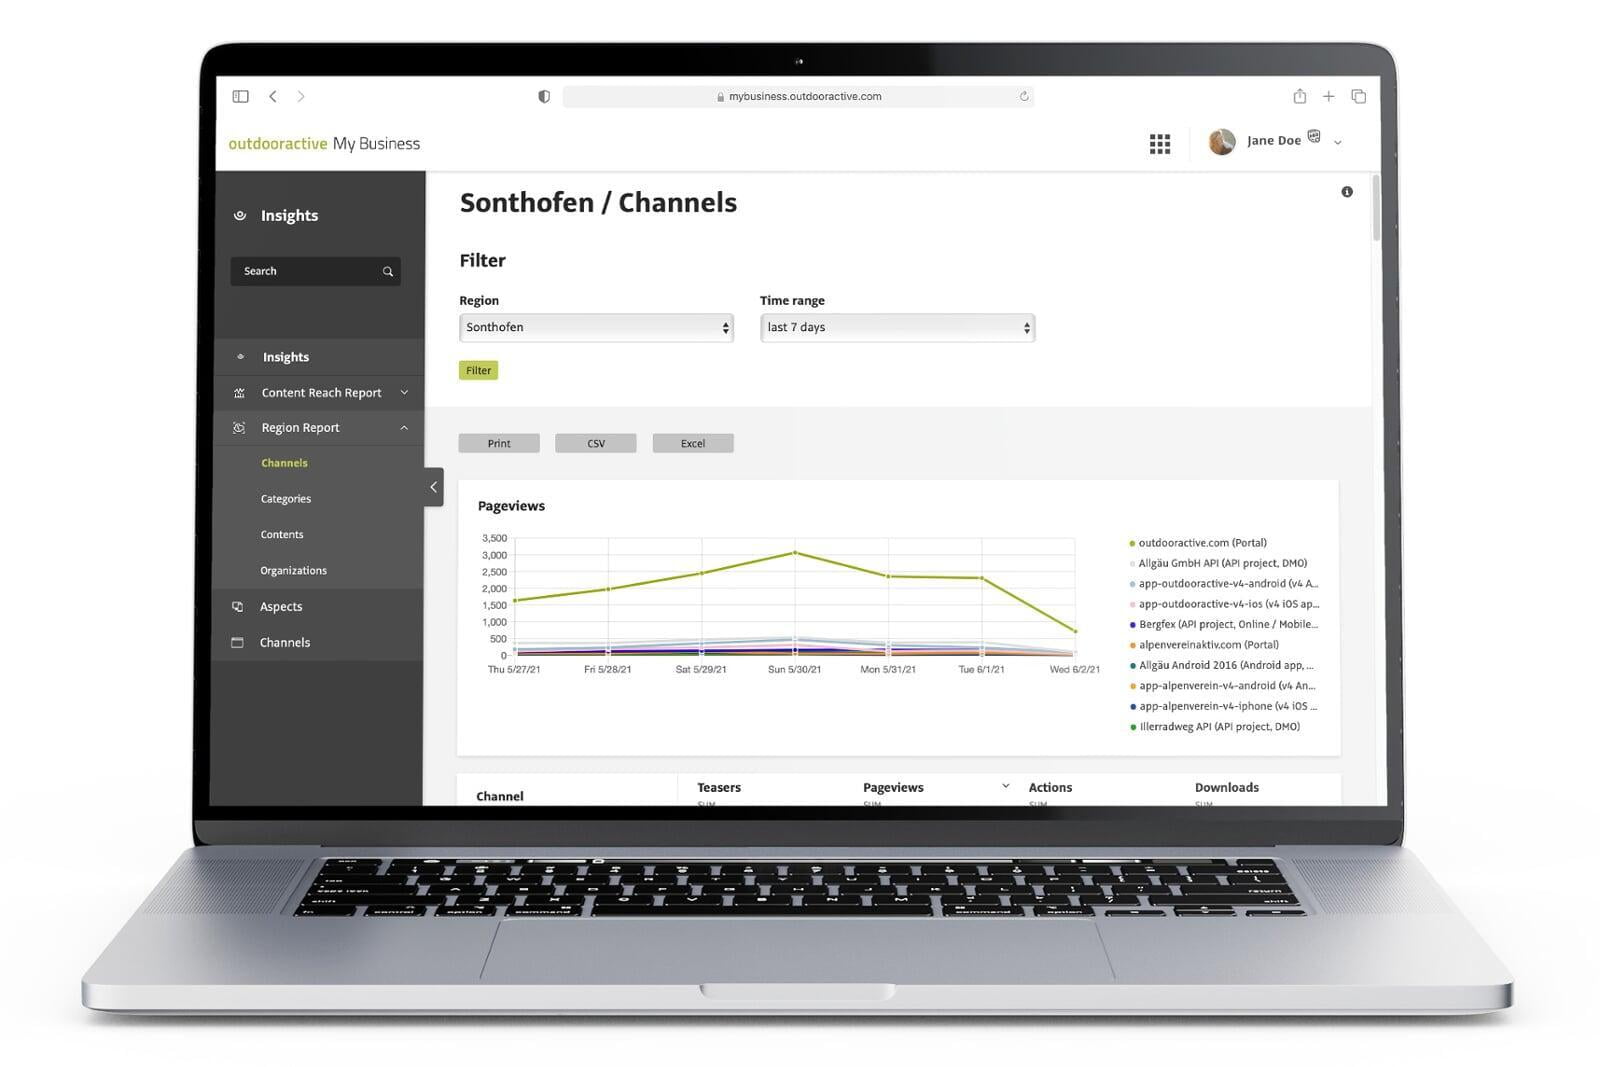
Identify what precisely is going on in your home region
Each destination plays a role in fostering tourism in your home region. The Region Report gives you insight into the performance of content in your home region of other businesses and the community for a more holistic, zoomed-out perspective.
This generates health competition, opens up collaboration possibilities, leverages other people's input, and helps you identify and refine your unique contribution to the region.
Pro+ feature.
Heatmaps that take visitor guidance to new heights
Heatmaps that take visitor guidance to new heights
Based on the use of the Outdooractive app and white-label partner apps, including connected devices, as well as WiFi and parking trackers, you can view extensive live data about your visitors' past and current movements and even forecast their future travel plans.
Choose between different views that show user location in your region, their recorded activity routes, and even app engagement. Continuous further development of this powerful tool ensures even greater robustness and stability in data analysis, making visitor guidance measures more effective.
Pro+ feature.
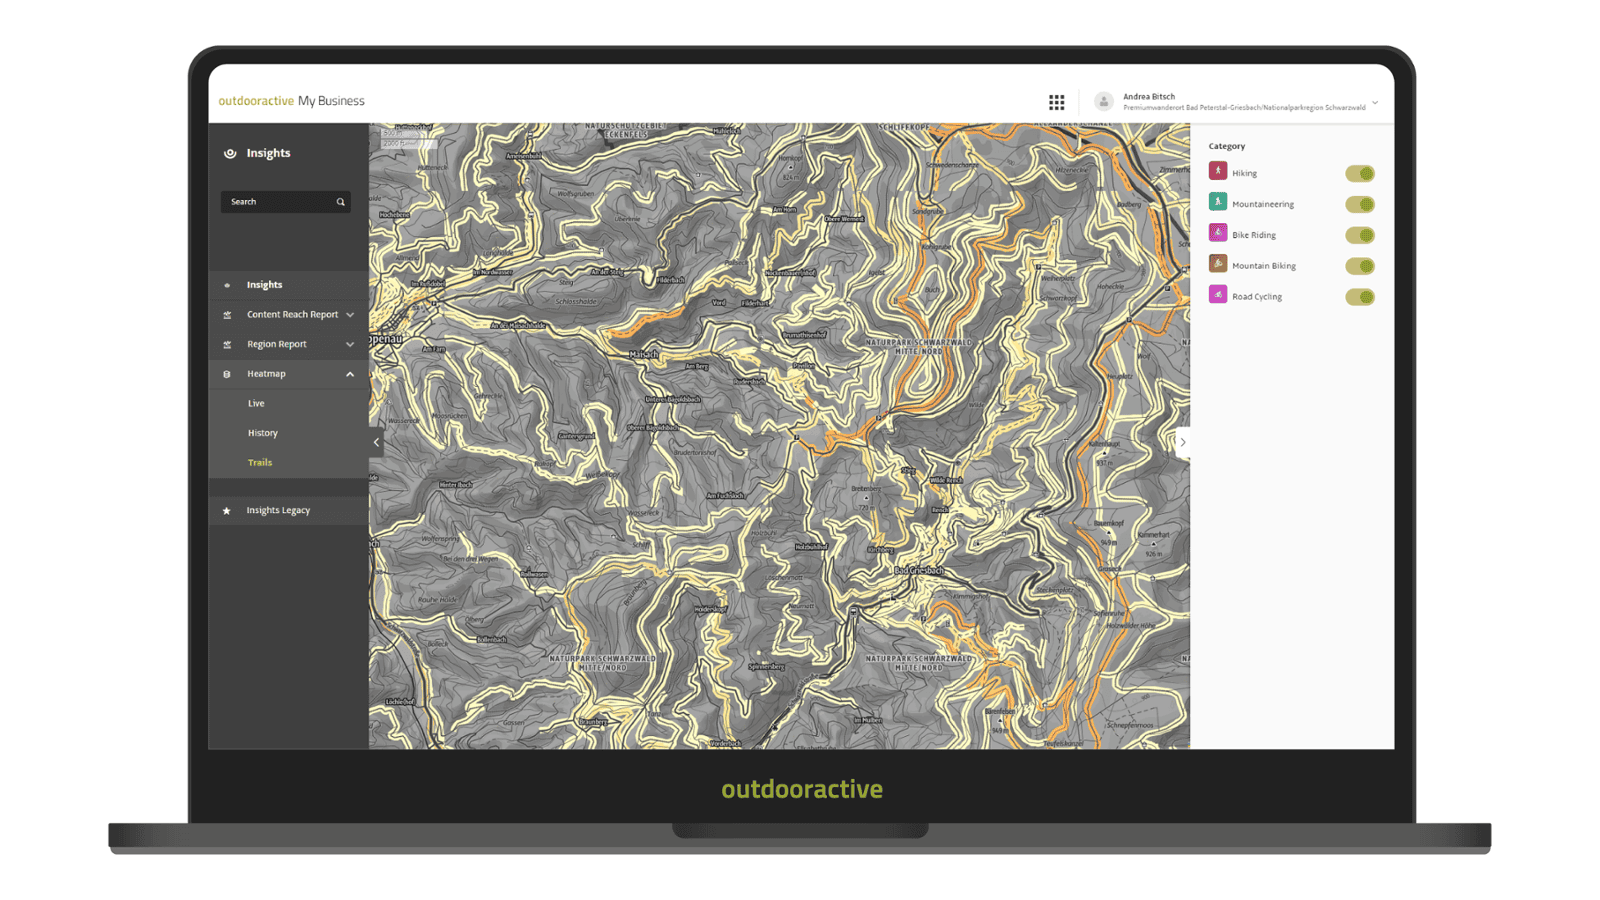

Heatmaps that take visitor guidance to new heights
Heatmaps that take visitor guidance to new heights
Based on the use of the Outdooractive app and white-label partner apps, including connected devices, as well as WiFi and parking trackers, you can view extensive live data about your visitors' past and current movements and even forecast their future travel plans.
Choose between different views that show user location in your region, their recorded activity routes, and even app engagement. Continuous further development of this powerful tool ensures even greater robustness and stability in data analysis, making visitor guidance measures more effective.
Pro+ feature.
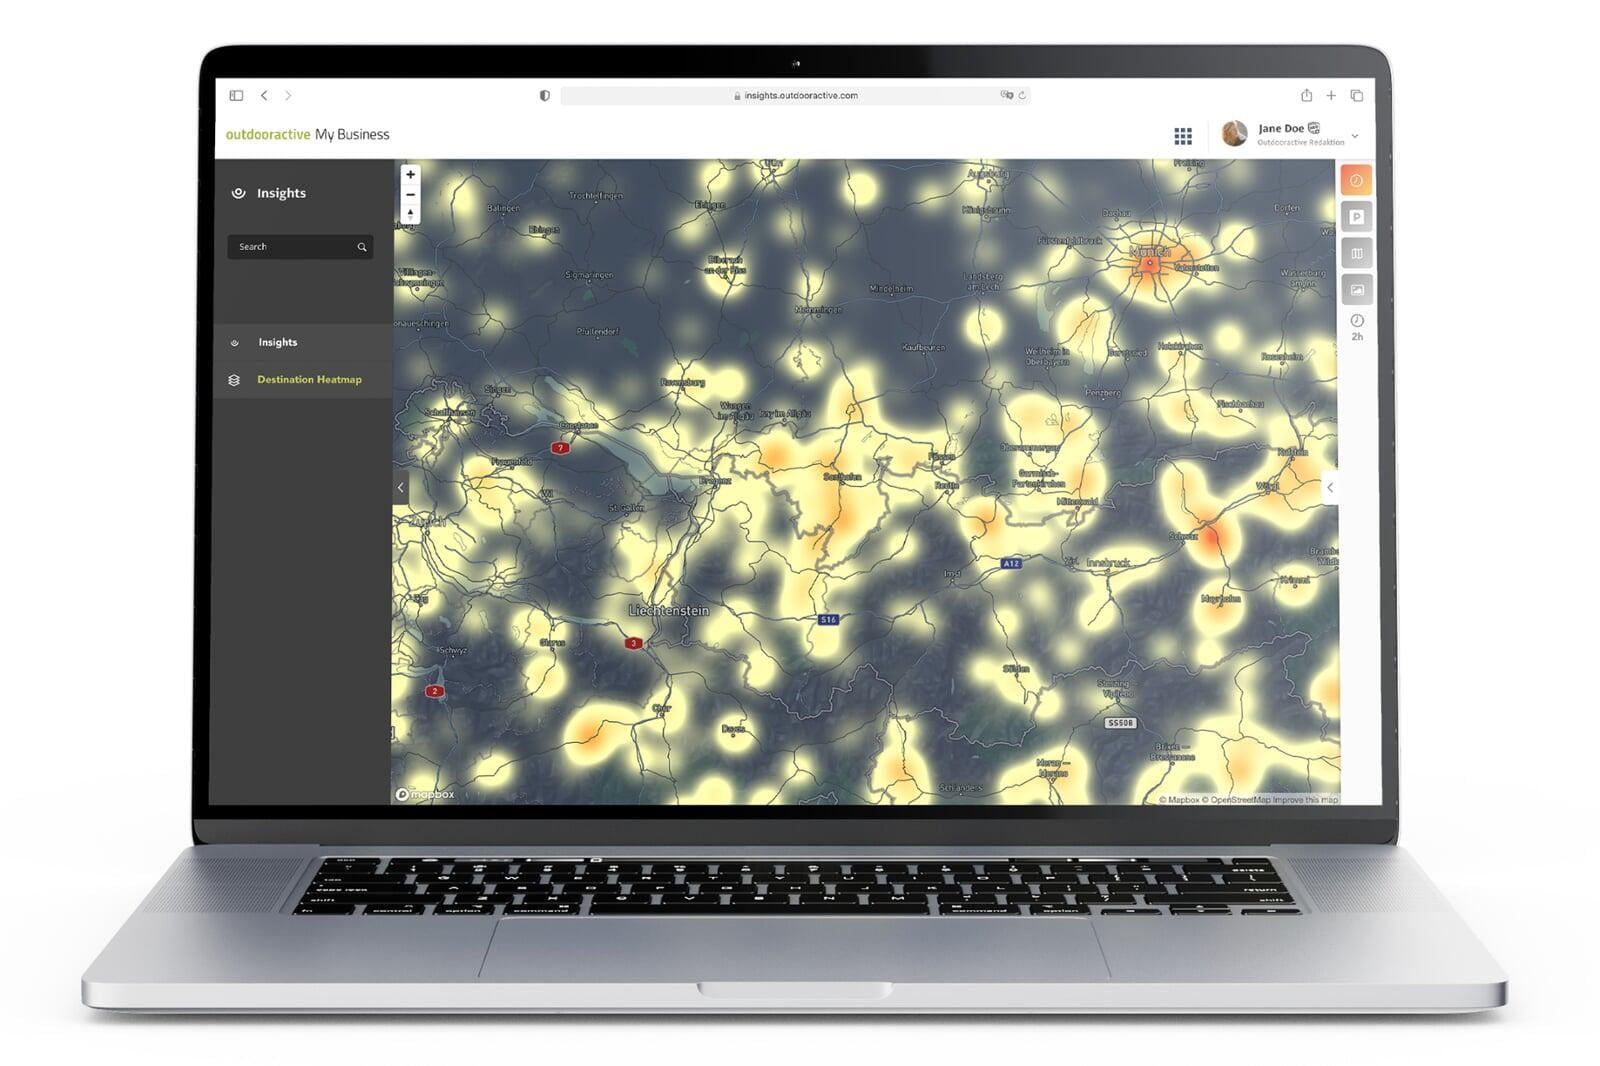
Live Heat Maps
Get extensive life data about your visitors movement and even their travel plans. Choose between different views that show you either the current positions of visitors in your region or the app activity and find out where they will be visiting before they even arrive.
Parking Occupation
Be aware of the occupations of parking lots in your region and react accordingly to avoid overcrowding or prohibited parking.
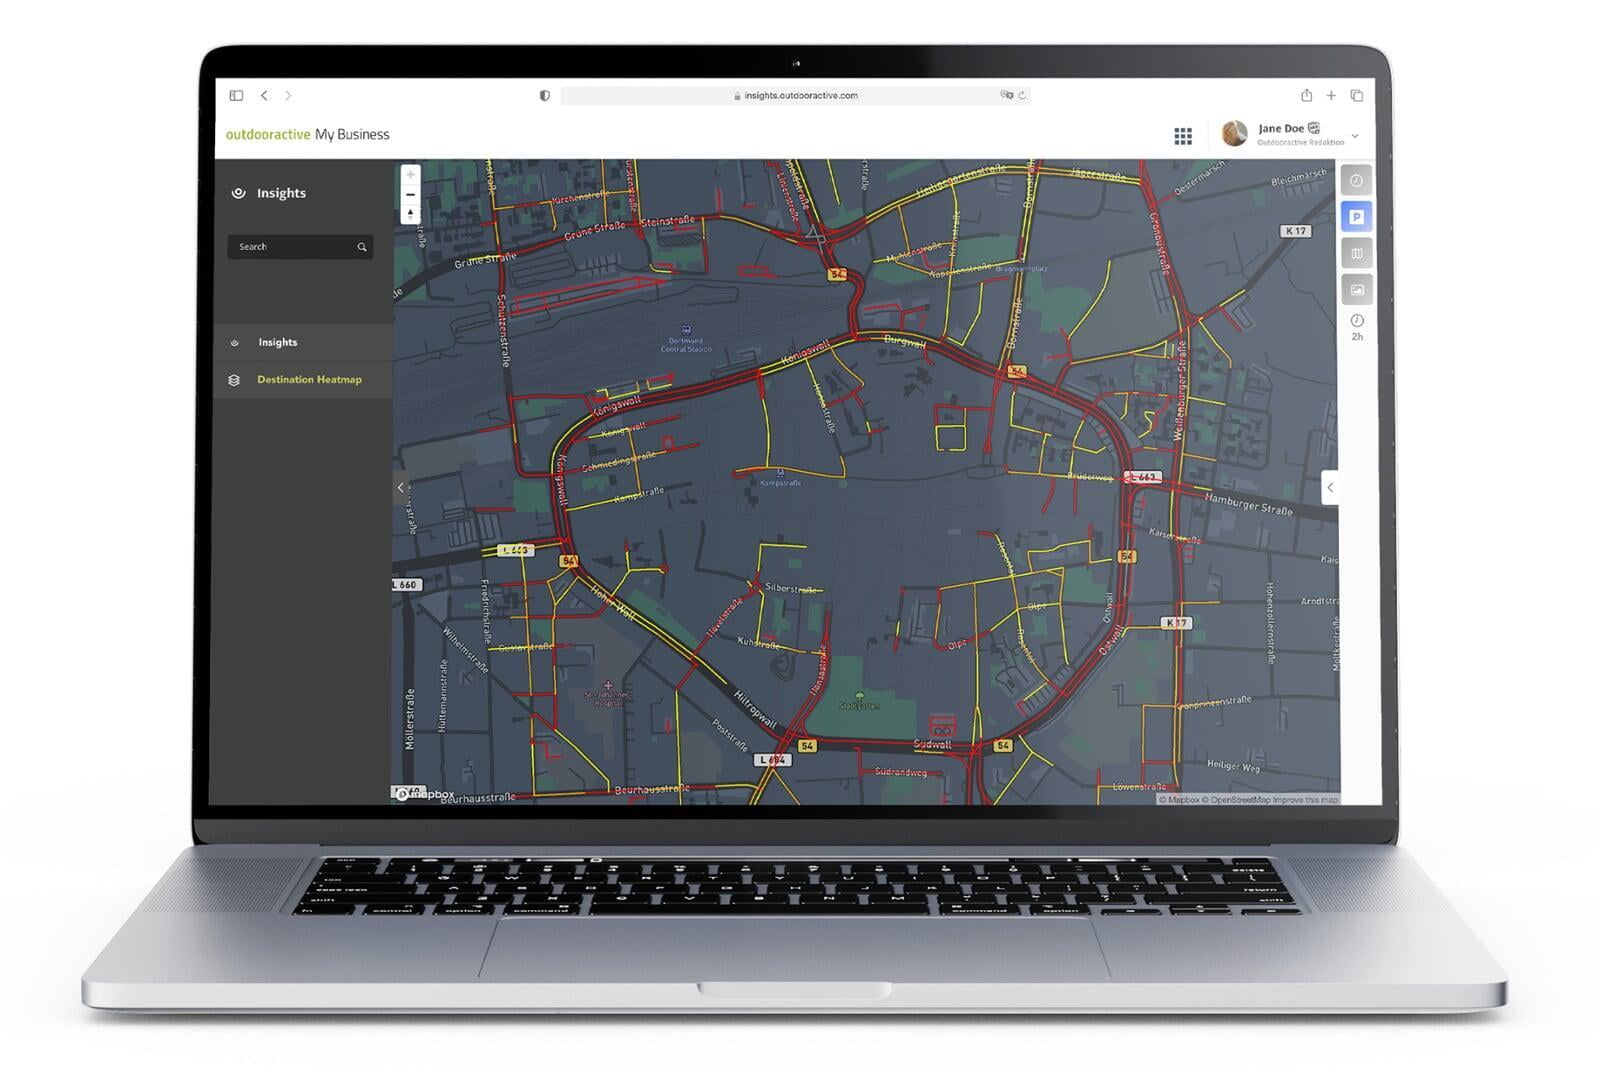
Parking Occupation
Be aware of the occupations of parking lots in your region and react accordingly to avoid overcrowding or prohibited parking.

App Analytics
Get extensive details on the performance of your Outdooractive content. Which POIs create the most interest, which routes are the most frequented. Based on the this data you are able to take even better strategic decisions.
App Analytics
Get extensive details on the performance of your Outdooractive content. Which POIs create the most interest, which routes are the most frequented. Based on the this data you are able to take even better strategic decisions.


