The digital trails that we leave tell a DMO everything about us that he or she might need to know.
Whether planning an entire vacation or just a short day trip, we leave digital traces on the Internet, as this is where pretty much everyone goes to for information in the modern world.Before we go
Before we go

From our homes, we look for information, we open pages, we plan our trip, we schedule, we save, and we might even book accommodation, tickets, guides, and experiences. In some cases, we might start getting inspired and planning months in advance. If we are especially organized, we might also save our trips and maps offline on our devices before we leave.
On the road
On the road

Our phones always know where we are, as we usually have our GPS activated. We open detail pages and rate, comment and like content. We ask questions and seek recommendations. We scan QR codes. We let navigate routes. We record our experiences in the form of pictures, videos and GPS tracks and share them on our social networks.
We build a digital profile
We build a digital profile
We show what our preferred activities and general preferences are. We reveal where we live, who our friends are, and our fitness levels.
How do destinations get hold of this data?
How do destinations get hold of this data?
Much of the data described above is held by other major Internet platforms and will continue to be unusable by destinations. However, as one of the world's largest platforms in outdoor tourism Outdooractive already has a large amount of data for your destination, which you can readily tap into access today. Having this data to hand gives you greater sovereignty and by using the Outdooractive platform throughout your destination, you can increase the number of users even further and in turn, gain even more data.
The more you work with Outdooractive, the more insights you get
The more you work with Outdooractive, the more insights you get

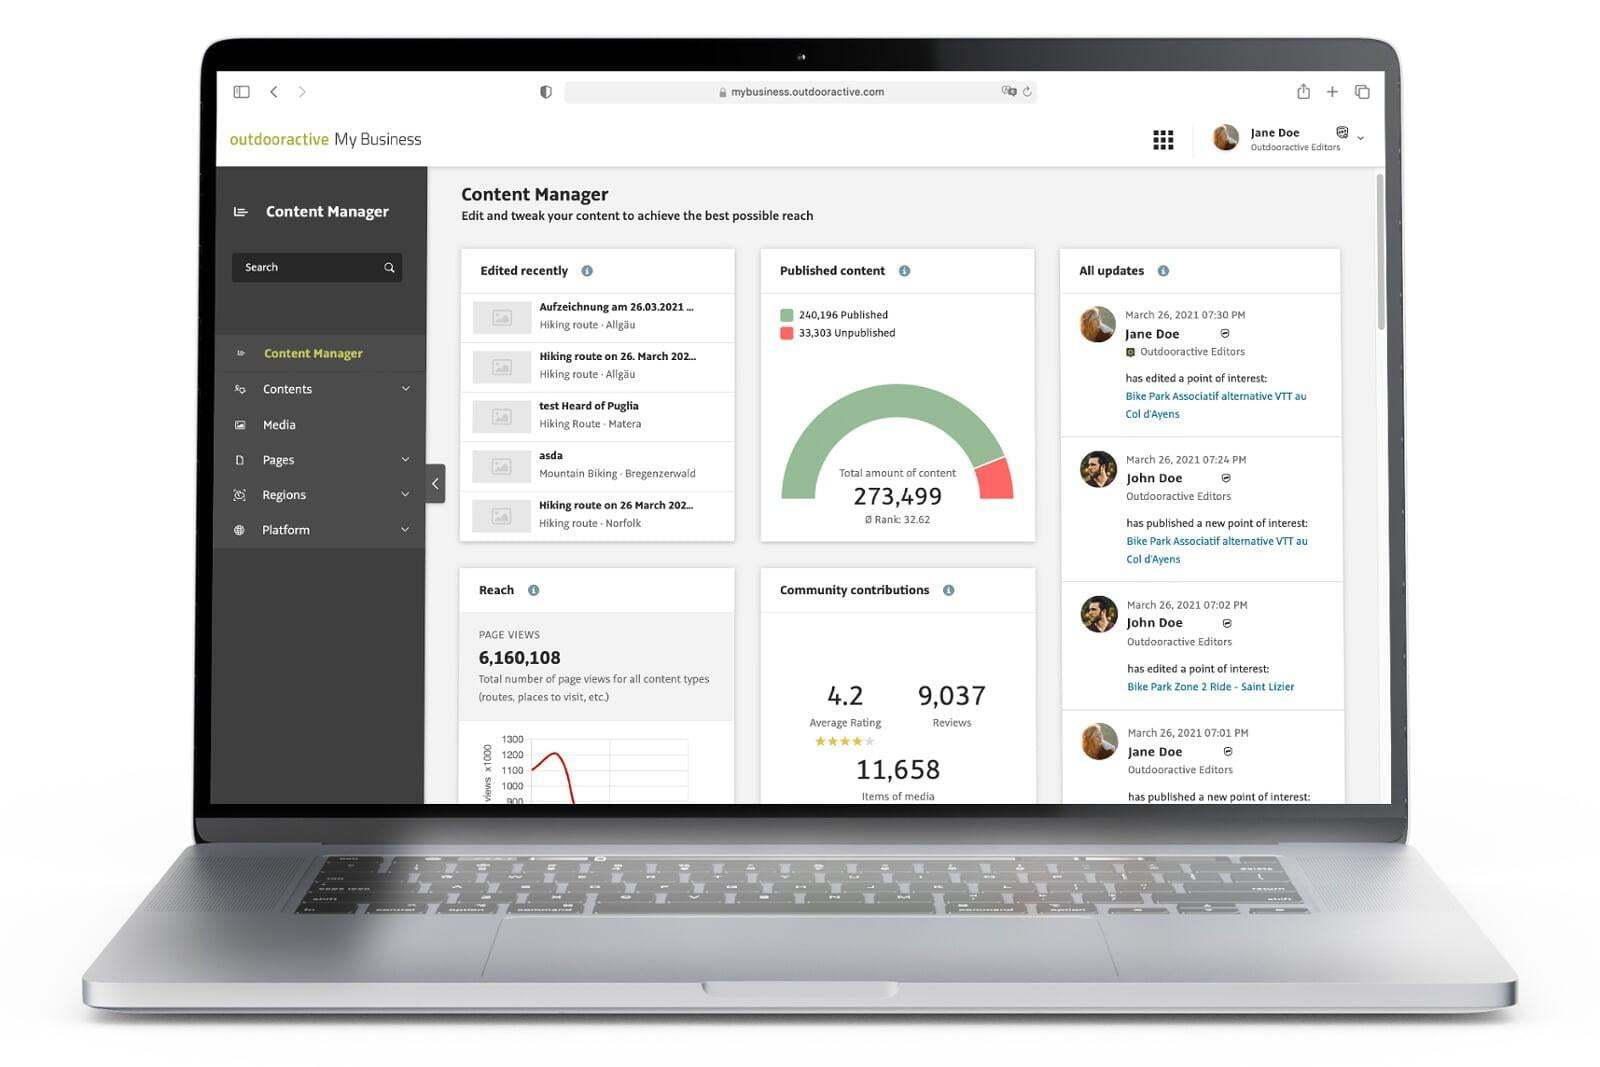
The Outdooractive platform is built to map and track a guest's journey in its entirety. This helps to seal your aim of creating the end-to-end digitization of your destination. After this, it is a matter of digitizing the guests and getting as much data from them as possible by capturing every click, comment, planned route, every recorded track, etc. Our analytics and visualization tools are constantly being developed to generate ever more insights, and our researchers are working on solutions for tomorrow such as, for example, the AIR project (Artificial Intelligence Recommender). Right now, we store more information than we currently use or display, but this will all become available as historical data over time.
Measuring parking occupancy
Measuring parking occupancy

Parking lots that use barriers and ticket machines are constantly measuring and generating data that can be transferred and added to the platform allowing anyone who needs to know what current occupancy rates are. Any other supplementary hardware present could also be used, but we would not advocate investing in such things from now on, as we see the future of parking data analysis lying in parking apps that allow digital payments. In cooperation with Easypark, the market leader in this area, we have developed a solution where we can transfer the current occupancy of parking lots in a destination to the platform in real time while also visualizing it on the map, including street parking and smaller lots. This data can also be stored and used for future forecasting and models.
Measuring visitor numbers on hiking and biking trails
Measuring visitor numbers on hiking and biking trails
As with parking, we already collect data from existing hardware. However, the scope of such technology is limited and serves more as references. At Outdooractive, we use these data points to help calibrate GPS-based software measurements when looking at visitor flows. Not 100% of ours users in the field will be using the Outdooractive app or website - or associated white label apps and websites – but from a penetration of around 20%, it is relatively safe to extrapolate the value to 100% using reference points.
WiFi access points
WiFi access points

Some WiFi systems also allow you visualize the number of users who are, for example, in a hotel reception area who are using WiFi on their devices. This data can also be imported into the platform and displayed as a traffic light graphic at, say a point of interest to gain an overall picture of the number of people there. Access control system can generate similar data.
Please contact us for more information and advice.

